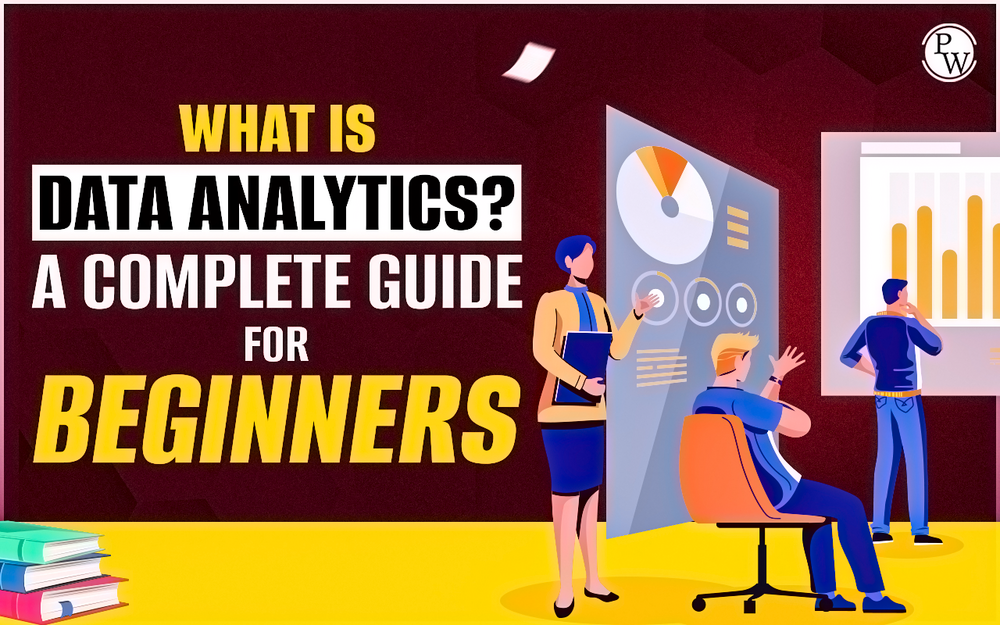
Introduction to Data Analytics: In the era of digital technology, data is frequently likened to the new oil—a valuable resource that fuels the modern world, impacting businesses, healthcare, and scientific progress. Nevertheless, what truly renders data transformative isn’t the raw information itself but our capacity to derive meaningful insights from it. This process of gleaning insights from data is commonly referred to as data analytics. If you want to build a successful career in data analytics, then a Mastering Data Analytics Course can be just what you need! In this blog, we’ll give you an introduction to data analytics and talk about data analytics in detail.
Introduction to Data Analytics
Data analytics is the practice of scrutinizing, cleansing, transforming, and interpreting data to unearth meaningful information, patterns, and trends. It empowers organizations to make data-driven decisions and gain a competitive advantage within their respective sectors. Data analytics constitutes a vital segment of data science, with its principal focus centered on the analytical phase.
Essentially, data analytics involves the subsequent pivotal stages:
- Data Collection: The act of accumulating data from various sources, which may encompass structured databases, unstructured text, or external APIs.
- Data Cleaning and Preparation: The refining and formatting of data to ensure its suitability for analysis. This phase often involves addressing issues like missing data, outliers, and ensuring data consistency.
- Data Analysis: Using assorted techniques and tools to explore the data and uncover patterns or relationships.
- Data Visualization: Creating graphs, charts, and visual representations of the data to enhance accessibility and comprehension.
- Interpretation and Reporting: The process of drawing conclusions, making predictions, and presenting findings to inform decision-making.
Recommended Technical Course
- Full Stack Web Development Course
- Generative AI Course
- DSA C++ Course
- Java+DSA 1.0 Course
- Data Analytics Course
- Data Science with ML 1.0 Course
Data Analytics vs. Data Science
In data-driven decision-making and problem-solving, Data Analytics and Data Science are sometimes employed interchangeably. Nevertheless, these are distinct disciplines, each possessing unique focal points, methodologies, and objectives. Understanding the differences between these two fields is imperative for individuals aspiring to enter the data profession and for organizations aiming to harness data effectively.
Data Analytics
Data analytics is the process of examining, cleaning, transforming, and interpreting data to discover meaningful information, patterns, and trends. It primarily concentrates on gleaning insights from historical data to inform decision-making.
Key Characteristics
- Descriptive and Diagnostic: Data analytics is chiefly concerned with describing past occurrences (descriptive analytics) and elucidating the reasons behind them (diagnostic analytics). It addresses questions like “What occurred?” and “Why did it happen?”
- Structured Data: Data analytics frequently grapples with structured data, which is meticulously organized and typically stored in databases or spreadsheets.
- Business-Centric: The central objective of data analytics is to bolster business decisions and assist organizations in understanding their past performance and making enhancements.
- Tools and Techniques: Data analysts wield a spectrum of tools and techniques for data exploration, including regression analysis, clustering, and data visualization. They employ programming languages such as SQL, Python, or R for data analysis.
- Reporting and Visualization: Data analysts craft reports and visual representations to convey insights to stakeholders in a lucid and comprehensible manner.
- Short-Term Focus: Data analytics predominantly scrutinizes short-term historical data to resolve immediate business challenges, optimize procedures, and augment performance.
Data Science
Data science constitutes a more expansive domain, encompassing data analytics but also encompassing predictive modeling and prescriptive analytics. It encompasses the utilization of various methods and algorithms to extract knowledge and insights from data.
Key Characteristics
- Predictive and Prescriptive: Data science surpasses descriptive and diagnostic analytics. It incorporates predictive analytics, which prophesizes future occurrences, and prescriptive analytics, which furnishes recommendations for actions.
- Unstructured Data: Data science often deals with unstructured and semi-structured data, such as text, images, and sensor data.
- Research and Experimentation: Data scientists conduct research, experiment with data, and construct models to answer intricate queries. They create and train machine learning models.
- Incorporates Advanced Algorithms: Data science harnesses machine learning algorithms and statistical models for predictive and prescriptive analytics, including decision trees, neural networks, and clustering algorithms.
- Long-Term Insights: Data science directs its focus towards long-term insights and forecasting, rendering it invaluable for strategic planning and future-oriented decision-making.
Also read: Data Science vs Data Analytics: Definition, Process, Role and Skills Required
Different Types of Data Analysis
Data analytics encompasses an array of analysis types, each serving a distinct purpose:
Descriptive Analytics
Descriptive analytics entails summarizing historical data to furnish a lucid perspective of past events. It concentrates on comprehending patterns and trends within the data. For instance, in the retail sector, descriptive analytics can unveil sales trends over the previous year, aiding businesses in making informed judgments concerning their inventory.
Diagnostic Analytics
Diagnostic analytics delves deeper into historical data to unravel the causes behind specific occurrences or results. It strives to respond to questions such as, “Why did sales decline in the previous quarter?” By identifying causal factors, businesses can undertake remedial measures.
Predictive Analytics
Predictive analytics leverages historical data to anticipate forthcoming events or trends. It incorporates the application of statistical models and machine learning algorithms to make predictions. For instance, healthcare providers employ predictive analytics to approximate patient readmission rates, enabling them to allocate resources more efficiently.
Prescriptive Analytics
Prescriptive analytics surpasses mere prediction and extends to providing recommendations for actions. It amalgamates historical data with optimization algorithms to propose the most prudent course of action. In the context of e-commerce, prescriptive analytics can suggest personalized product recommendations to enrich the customer shopping experience.
Also read: Top 10 Data Analytics Tools for 2024
Real-World Data Analytics Case Studies
To gain deeper insights into the practical utility of data analytics, let’s scrutinize a few authentic case studies:
Case Study 1: Retail Industry
The retail sector heavily relies on data analytics to optimize inventory management. By analyzing historical sales data, retailers can prognosticate demand, ascertain the ideal stock levels for diverse products, and reduce expenses linked to overstocking or understocking. This not only augments profitability but also ensures that customers find the products they need when they visit a store or shop online.
Case Study 2: Healthcare
In the realm of healthcare, data analytics plays a pivotal role in elevating patient outcomes. Hospitals and healthcare providers employ electronic health records (EHR) and data analytics to monitor patient data and identify patterns that can lead to improved diagnosis and treatment. For example, through the analysis of patient data, hospitals can detect early signs of diseases and curtail readmission rates.
Case Study 3: Financial Services
The financial sector harnesses data analytics to unearth fraudulent activities and gauge risks. Banks and credit card companies utilize data analytics to oversee transactions in real-time, identifying irregular patterns that may indicate fraud. Moreover, risk assessment models facilitate financial institutions in making lending determinations, ensuring that loans are extended to creditworthy borrowers.
Case Study 4: E-commerce
E-commerce platforms employ data analytics to elevate the customer experience and boost sales. By analyzing customer behavior and preferences, e-commerce entities can provide personalized product recommendations, targeted marketing campaigns, and efficient supply chain management. This, in turn, heightens customer contentment and amplifies revenue.
The Role of a Data Analyst
In a data-driven universe, data analysts play a pivotal role in transforming raw information into invaluable insights that steer informed decision-making. These professionals bridge the chasm between extensive datasets and actionable knowledge, aiding organizations in optimizing their operations, refining strategies, and attaining their objectives.
The role of a data analyst is dynamic and multifaceted, encompassing an array of responsibilities spanning various phases of the data analytics process.
Responsibilities of a Data Analyst
Data Collection
- Gathering Data: Data analysts are tasked with accumulating data from a diverse range of sources, including databases, spreadsheets, web APIs, and more.
- Data Validation: Ensuring the accuracy, completeness, and relevance of the collected data to the ongoing analysis.
- Data Extraction: Efficiently and securely extracting data from different databases and sources.
Data Cleaning and Preparation
- Data Cleaning: Identifying and rectifying data quality issues, such as missing values, duplicates, and inconsistencies.
- Data Transformation: Converting raw data into a structured format suitable for analysis.
- Data Integration: Merging data from various sources and formats to construct a unified dataset.
Data Analysis
- Exploratory Data Analysis (EDA): Employing statistical and visualization techniques to unearth insights within the data, identify patterns, and discover potential relationships.
- Hypothesis Testing: Formulating and verifying hypotheses to substantiate or refute assumptions based on data.
- Statistical Modeling: Constructing models to elucidate and foresee outcomes grounded in historical data.
Data Visualization
- Data Visualization Tools: Crafting charts, graphs, and dashboards to visually communicate data and findings effectively to stakeholders.
- Storytelling with Data: Formulating engaging narratives centered around data to render it more comprehensible and impactful for non-technical audiences.
Reporting
- Creating Reports: Formulating comprehensive reports that encapsulate the analysis, findings, and recommendations.
- Presentations: Delivering clear and captivating presentations to stakeholders, often translating intricate data insights into actionable strategies.
Decision Support
- Assisting Decision-Making: Aiding decision-makers in making choices that hinge on data by providing the requisite information and insights.
- Strategic Planning: Collaborating with teams to devise data-informed strategies for business expansion and process enhancement.
Also read: What Qualification Is Required for a Data Analyst?
Impact of a Data Analyst Across Industries
Data analysts are in high demand across an array of industries, each characterized by distinctive applications and challenges:
- In Retail, data analysts facilitate the optimization of inventory management, pricing strategies, and customer segmentation, culminating in increased profitability and customer gratification.
- In Healthcare, data analysts enhance patient outcomes by unearthing patterns within patient data, optimizing resource allocation, and predicting disease outbreaks.
- In Financial Services, they expose fraudulent activities, evaluate risk, and forge algorithms for automated trading and investment tactics.
- In E-commerce, data analysts elevate the customer experience by suggesting products, optimizing supply chains, and undertaking A/B testing for website enhancements.
- In Education, they harness data to ameliorate teaching approaches, enhance student performance, and allocate resources more effectively.
- In Manufacturing, data analysts employ predictive maintenance models to diminish machinery downtime and streamline production processes.
- In Sports Analytics, they scrutinize player performance data to steer team strategies, player recruitment, and fan engagement.
- In Social Media, data analysts yield insights into user conduct, ad performance, and content recommendations.
- In Environmental Sciences, they utilize data to supervise climate changes, foretell natural disasters, and optimize resource management.
The Data Analytics Process
The data analytics process generally adheres to a structured trajectory, albeit it may fluctuate contingent on the specific task and organization. Here’s a generalized breakdown of the typical process:
- Data Collection: The accumulation of data from various sources, encompassing databases, APIs, or external datasets.
- Data Cleaning and Preparation: The refinement and preprocessing of data to ascertain its accuracy and readiness for analysis. This often entails addressing matters such as missing data, outliers, and data transformation.
- Data Analysis: The utilization of statistical techniques, machine learning algorithms, and data visualization to explore and dissect the data.
- Data Visualization: The creation of charts, graphs, and visual representations to facilitate the comprehension of intricate data.
- Interpretation and Reporting: The derivation of conclusions from the analysis and the presentation of findings in a manner that shapes decision-making. This often necessitates the creation of reports and presentations.
- Feedback and Iteration: The scrutiny of results, the collection of feedback, and the iteration on the analysis when necessary. Continuous improvement stands as an integral facet of the process.
Data Analytics Tools and Techniques
Data Analytics Techniques
Data analysts employ a spectrum of techniques to unearth insights from data:
- Regression Analysis: Unravels relationships between variables and forecasts outcomes.
- Clustering Analysis: Groups data points with similar attributes.
- Time Series Analysis: Scrutinizes data over time to expose trends and patterns.
Data Analytics Tools
Diverse tools and software are applied by data analysts, contingent on the nature of the analysis:
- Excel: A versatile tool for data analysis and visualization.
- R: A programming language recognized for its statistical analysis capabilities and data visualization packages.
- Python: Extensively utilized for data analysis and machine learning.
- Tableau: A data visualization tool for generating interactive, shareable dashboards.
Also read: 11 Data Analyst Skills You Need to Get Hired in 2024
Skills Required to Become a Data Analyst
Attaining success as a data analyst entails the possession of a diverse array of skills, spanning both technical and soft categories. Let’s delve into these skills in further detail:
Technical Skills
Programming Languages
- Python: Renowned for data analysis due to its extensive libraries like Pandas and NumPy.
- R: Acknowledged for its statistical analysis capabilities and data visualization packages.
- SQL: Adeptness in querying relational databases for data retrieval and manipulation.
Data Manipulation and Cleaning
- Data Wrangling: The capacity to cleanse and reshape raw data into a usable format.
- Data Integration: The amalgamation of data from various sources and formats into a consistent dataset.
Statistical Analysis
- Statistical Techniques: Familiarity with descriptive and inferential statistics, encompassing regression analysis and hypothesis testing.
- Time Series Analysis: The scrutiny of data amassed over time to unveil patterns and trends.
Data Visualization
- Data Visualization Tools: Proficiency in tools such as Tableau, Matplotlib, Seaborn, or ggplot2 for crafting meaningful visualizations.
- Data Storytelling: The skill to formulate narratives based on data to render it more accessible and impactful.
Analytical Skills
Critical Thinking
- Pattern Recognition: The capability to identify trends, anomalies, and insights within data.
- Problem-Solving: The capability to tackle intricate data-related challenges with innovative solutions.
Attention to Detail
- Data Quality Assurance: Ensuring the accuracy, completeness, and consistency of data.
- Precision: Minimizing errors and ensuring that analyses are grounded in high-quality data.
Soft Skills
Communication
- Clear Communication: The ability to elucidate intricate data insights in a lucid and understandable manner for non-technical stakeholders.
- Active Listening: Grasping the requirements and needs of diverse teams and departments.
Teamwork
- Collaboration: Effectively working with cross-functional teams, encompassing data engineers, business analysts, and decision-makers.
- Knowledge Sharing: Assisting others in comprehending and leveraging data for their responsibilities.
Adaptability
- Continuous Learning: Staying abreast of evolving technologies and methodologies in the dynamic domain of data analytics.
- Flexibility: Adapting to shifts in project requirements and data sources.
Final Words
Data analytics serves as the gateway to unlocking the potential of data. It empowers businesses, organizations, and individuals to make informed decisions, address complex challenges, and uncover invaluable insights.
As a data analyst, you have the opportunity to take a leading role in this dynamic and continually expanding field. With the right skill set and a dedication to ongoing learning, you can embark on a gratifying journey in data analytics, molding the future of decision-making in our data-centric world.
Learn the in-demand skills of data analytics with Physics Wallah’s Matering Data Analytics Course. Get the skills you need to land a high-paying job in the data analytics industry. Learn from industry experts and get hands-on experience with real-world data analytics problems. Enroll today and start your journey to a successful career in data analytics!
PW Skills Provide Various Platform
FAQs
What's the main difference between data analytics and data science?
Data analytics focuses on past data for immediate decisions, while data science includes predictive and research-oriented analytics.
Do data analysts and data scientists use different tools and techniques?
Yes, data analysts use stats and visual tools, while data scientists employ machine learning.
How does the scope of data analytics and data science differ?
Data analytics is past-focused for optimization, while data science includes future-oriented tasks.
Can data analysts and data scientists collaborate on projects?
Absolutely! They often work together, with analysts preparing data for scientists.
What are the common industry applications of data analytics and data science?
Data analytics optimizes retail, healthcare, and finance. Data science personalizes e-commerce, analyzes social media, and predicts in healthcare.