Process of Business Analytics is explained below in this article. Business analytics is a systematic approach to analyzing vast datasets to uncover trends, patterns, and insights that can inform business decisions and strategies.
Process of Business Analytics: One way to conceptualize business analysis is as a research field that assists in determining business needs and problem-solving strategies. The creation of software or system components, process enhancements, organizational modifications, or the creation of strategic plans and policies are a few examples of these solutions. Business analysis’s goal is to find solutions that address the requirement for development.

The business analysis process provides ideas and perceptions on how every project’s first framework is developed. It has the secret to directing project participants who carry out business modeling in a systematic way.
Learning is a continuous process and there is always more to explore in the field of business analytics. That’s why we would highly recommend checking out Physics Wallah’s Data Analytics course. And just for being a reader of this blog post, use the coupon code “READER” to get a special discount on the course.
So take action now and start your journey towards becoming a skilled and successful business analyst.
Process of Business Analytics With Examples
Business analytics is a systematic approach to analyzing data and deriving actionable insights to drive informed decision-making, optimize processes, and achieve strategic objectives. Below is a step-by-step explanation of the business analytics process, illustrated with examples for better understanding.
1) Define Objectives and Scope:
- Example: A retail company aims to increase sales and improve customer satisfaction. The objective is to analyze customer purchasing behavior, identify trends, and develop targeted marketing strategies to enhance customer engagement and loyalty.
2) Data Collection and Integration:
- Example: The retail company collects data from various sources, including point-of-sale (POS) systems, customer relationship management (CRM) platforms, online transactions, and social media channels. Data integration tools like Talend or Apache Kafka are used to consolidate and unify data from these disparate sources into a centralized data repository.
3) Data Exploration and Preparation:
- Example: Data analysts explore the collected data to identify patterns, trends, and correlations related to customer preferences, purchasing behavior, and product preferences. They clean, preprocess, and transform the data using tools like Python or R, addressing missing values, outliers, and inconsistencies to ensure data quality and readiness for analysis.
4) Data Analysis and Modeling:
- Example: Data scientists apply statistical analysis and machine learning algorithms to analyze customer data, develop predictive models, and identify factors influencing sales and customer satisfaction. They use tools like IBM SPSS or SAS to perform regression analysis, clustering, and classification to uncover insights, forecast trends, and make data-driven recommendations.
5) Data Visualization and Reporting:
- Example: The data insights are visualized using interactive dashboards and reports created with tools like Tableau or Microsoft Power BI. The dashboards display key metrics, KPIs, and visualizations such as sales trends, customer segmentation, and product performance, enabling stakeholders to explore data, identify patterns, and make informed decisions.
6) Insight Interpretation and Action Planning:
- Example: Based on the insights derived from the data analysis and visualization, the retail company develops actionable strategies and initiatives to enhance customer engagement, optimize product offerings, and improve sales performance. For instance, they launch targeted marketing campaigns, introduce personalized promotions, and enhance product recommendations to drive customer satisfaction and loyalty.
7) Implementation and Monitoring:
- Example: The retail company implements the recommended strategies and initiatives, closely monitoring their effectiveness, impact, and ROI. They track key performance indicators (KPIs) such as sales growth, customer retention rates, and marketing campaign performance, using tools like Google Analytics or Adobe Analytics to measure, evaluate, and optimize their efforts continuously.
Process of business analytics with Diagram
With below conceptual diagram description, you can create a visual representation of the process of business analytics that illustrates the sequential flow, key stages, and interconnected tasks involved in transforming raw data into actionable insights, driving informed decision-making, and achieving strategic objectives in today’s data-driven business landscape.
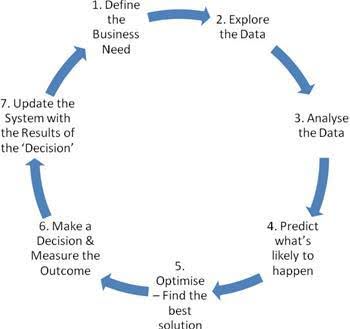
Steps in Business Analytics Process
The business analytics process is a systematic approach that enables organizations to harness the power of data to make informed decisions, drive strategic initiatives, and achieve competitive advantage. Below, we delve into a detailed exploration of the seven critical steps involved in this transformative process.
Step 1: Define Business Needs
The journey begins with a clear understanding of the organization’s objectives and challenges. Stakeholders, business users, and analysts collaborate to define specific business goals and identify the relevant data required to achieve them. Essential questions regarding data availability, usability, and sufficiency are addressed to lay a solid foundation for subsequent stages.
Step 2: Data Exploration and Preparation
Once the objectives are defined, the focus shifts to data exploration and preparation. This phase involves rigorous data cleaning, handling missing values, outlier detection, and variable transformation to ensure data integrity and reliability. Visual exploratory techniques, such as scatter plots and time series graphs, are employed to uncover patterns, correlations, and anomalies, thereby providing insights into the underlying data structure and quality.
Step 3: Data Analysis
In this stage, sophisticated statistical analysis techniques, including correlation analysis, hypothesis testing, and regression analysis, are utilized to explore relationships between variables and identify significant factors influencing the target outcome. The data is meticulously analyzed, sliced, and diced to derive actionable insights, enabling organizations to understand trends, patterns, and key drivers that impact business performance.
Step 4: Predictive Modeling
Armed with insights from the analysis phase, predictive modeling techniques, such as decision trees, neural networks, and logistic regression, are employed to forecast future trends, behaviors, and outcomes. Multiple models are evaluated based on accuracy, performance metrics, and alignment with organizational goals to select the most robust and reliable predictive model.
Step 5: Solution Optimization
The optimization stage involves leveraging the predictive model to evaluate various ‘what-if’ scenarios, simulate outcomes, and identify the optimal solution that aligns with organizational objectives, constraints, and strategic goals. By fine-tuning model parameters and evaluating alternative scenarios, organizations can make informed decisions that maximize efficiency, effectiveness, and return on investment.
Step 6: Decision Making and Outcome Measurement
With a comprehensive understanding of the insights derived from the analytics process, organizations make informed decisions, implement strategic initiatives, and take actionable steps to achieve desired outcomes. Post-implementation, the effectiveness of decisions and actions is systematically measured against predefined metrics, KPIs, and performance indicators to assess impact, identify areas for improvement, and refine strategies as needed.
Step 7: Systematic Update and Continuous Improvement
The final step in the business analytics process involves systematically updating the organizational database with insights, outcomes, and lessons learned from the decision-making process. By continuously monitoring performance, evaluating results, and integrating new insights into the database, organizations create a dynamic, evolving analytics ecosystem that fosters innovation, drives continuous improvement, and enables agile decision-making in an ever-changing business landscape.
Business analytics process is a holistic, data-driven approach that empowers organizations to transform raw data into actionable insights, informed decisions, and strategic initiatives that drive business growth, enhance competitiveness, and unlock new opportunities for innovation and success. By systematically navigating through these seven steps, organizations can harness the full potential of data analytics to achieve sustainable growth, mitigate risks, and create value for stakeholders across the enterprise.
Also Read: Graph Analytics – What Is it and Why Does It Matter?
Benefits of Business Analytics
Business analytics has emerged as a pivotal tool for organizations across industries, enabling them to transform raw data into actionable insights, informed decisions, and strategic advantages. Below are some of the key benefits associated with leveraging business analytics:
- Business analytics provides organizations with the necessary insights and information to make data-driven decisions. By analyzing historical data, current trends, and predictive analytics, decision-makers can evaluate various scenarios, assess risks, and identify opportunities, leading to more informed and effective decision-making processes.
- Business analytics enables organizations to gain a deeper understanding of customer behavior, preferences, and needs. By analyzing customer data, organizations can segment their customer base, personalize marketing strategies, improve customer engagement, and enhance overall customer satisfaction and loyalty.
- By analyzing operational data and processes, business analytics helps organizations identify inefficiencies, streamline operations, optimize resource allocation, and reduce costs. Through process optimization and performance monitoring, organizations can enhance productivity, profitability, and competitiveness in the marketplace.
- Business analytics empowers organizations to gain a competitive edge by identifying market trends, consumer preferences, and emerging opportunities. By analyzing market data, competitor performance, and industry trends, organizations can develop innovative products, services, and strategies that differentiate them from competitors and position them for success in the marketplace.
- Business analytics enables organizations to proactively identify, assess, and mitigate risks by analyzing historical data, trends, and predictive analytics. By identifying potential risks, organizations can develop strategies to minimize exposure, protect assets, and ensure business continuity, thereby enhancing resilience and sustainability in an increasingly complex and uncertain business environment.
- By leveraging business analytics to optimize sales and marketing strategies, organizations can identify new market opportunities, target high-value customers, and maximize revenue growth. Through data-driven insights, organizations can tailor their products, services, and marketing efforts to meet customer needs, drive sales, and achieve revenue targets.
- Business analytics enables organizations to develop and implement strategic plans based on data-driven insights, market trends, and predictive analytics. By analyzing internal and external data, organizations can identify opportunities, assess market dynamics, and develop strategic initiatives that align with their long-term goals and objectives.
- Business analytics provides organizations with the tools and insights to effectively communicate with stakeholders, including employees, customers, investors, and partners. By analyzing stakeholder data and feedback, organizations can identify opportunities to enhance engagement, build trust, and foster collaboration, ultimately driving organizational success and stakeholder satisfaction.
Also Check: What is the difference between big data analysis and analytics?
Process of Business Analytics Notes
Business analytics is a systematic approach to transforming raw data into actionable insights that drive informed decision-making, optimize processes, and achieve strategic objectives. The process of business analytics involves several key stages, methodologies, and techniques to extract value from data. Here are some key notes outlining the process of business analytics:
1) Define Objectives and Scope:
- Clearly articulate the business objectives, goals, and scope of the analytics project.
- Identify key stakeholders, data sources, and relevant metrics to align analytics efforts with organizational priorities and requirements.
2) Data Collection and Integration:
- Gather relevant data from various internal and external sources, including databases, CRM systems, ERP systems, web analytics tools, and third-party sources.
- Integrate and consolidate data to create a unified view of the business, ensuring data quality, consistency, and reliability.
3) Data Exploration and Preparation:
- Explore and analyze data to identify patterns, trends, correlations, and outliers.
- Cleanse, transform, and preprocess data to address missing values, outliers, and inconsistencies, ensuring data integrity and readiness for analysis.
4) Data Analysis and Modeling:
- Apply statistical analysis, machine learning, and predictive modeling techniques to derive insights, forecast trends, and uncover relationships within the data.
- Develop and evaluate predictive models, hypothesis tests, and statistical models to identify patterns, make predictions, and validate assumptions.
5) Data Visualization and Reporting:
- Visualize insights, findings, and recommendations using interactive dashboards, charts, graphs, and reports.
- Communicate complex data and insights effectively to stakeholders, decision-makers, and other relevant parties using visualization tools and storytelling techniques.
6) Insight Interpretation and Action Planning:
- Interpret findings, insights, and recommendations in the context of business objectives, goals, and challenges.
- Collaborate with stakeholders to develop actionable strategies, initiatives, and solutions based on data-driven insights and analysis.
7) Implementation and Monitoring:
- Implement recommended strategies, initiatives, and solutions to address business challenges, optimize processes, and achieve desired outcomes.
- Monitor, evaluate, and measure the impact, effectiveness, and ROI of implemented solutions using key performance indicators (KPIs), metrics, and performance analytics.
8) Continuous Improvement and Optimization:
- Continuously refine, optimize, and iterate analytics processes, methodologies, and techniques to adapt to changing business requirements, technologies, and market dynamics.
- Foster a culture of data-driven decision-making, innovation, and continuous improvement across the organization to drive growth, efficiency, and competitiveness.
5 Stages of Business Analytics Application Advancement
The application of business analytics within organizations evolves through distinct stages as companies mature in their data-driven decision-making capabilities. Understanding these stages can help organizations identify where they currently stand and what steps they need to take to advance their analytics capabilities further. Here are the five stages of business analytics application advancement:
Stage 1: Descriptive Analytics (What Happened?)
The initial stage of business analytics focuses on descriptive analytics, which involves analyzing historical data to understand past performance and trends. Organizations at this stage use basic reporting tools and techniques to summarize data, generate dashboards, and visualize key metrics and KPIs.
Descriptive analytics provides insights into what happened, allowing organizations to monitor performance, track key metrics, and gain a foundational understanding of their business operations.
Stage 2: Diagnostic Analytics (Why Did It Happen?)
As organizations progress, they move to the diagnostic analytics stage, which involves exploring data to identify patterns, correlations, and relationships to understand why specific events occurred.
At this stage, organizations leverage advanced analytics tools and techniques, such as data mining, statistical analysis, and exploratory data analysis, to uncover insights into the root causes of performance trends, anomalies, and issues. Diagnostic analytics enables organizations to diagnose problems, identify opportunities for improvement, and make data-driven decisions based on a deeper understanding of underlying factors and relationships.
Stage 3: Predictive Analytics (What Will Happen?)
In the predictive analytics stage, organizations use statistical, machine learning, and predictive modeling techniques to forecast future trends, behaviors, and outcomes based on historical data and existing patterns. By analyzing historical data, identifying predictive variables, and developing predictive models, organizations can anticipate customer behavior, market trends, operational risks, and other critical factors that impact business performance.
Predictive analytics enables organizations to proactively address challenges, capitalize on opportunities, and make informed decisions to drive growth, efficiency, and competitive advantage.
Stage 4: Prescriptive Analytics (How Can We Make It Happen?)
As organizations advance, they move to the prescriptive analytics stage, which involves leveraging advanced analytics techniques, optimization algorithms, and decision-making models to recommend actions, strategies, and solutions to achieve specific objectives and outcomes.
By combining insights from descriptive, diagnostic, and predictive analytics, prescriptive analytics enables organizations to identify the most effective courses of action, optimize decision-making processes, and align strategies with business goals. Prescriptive analytics empowers organizations to make informed decisions, optimize resources, and drive continuous improvement by providing actionable recommendations based on data-driven insights and analysis.
Stage 5: Cognitive Analytics (Automated Decision Making and Learning)
The most advanced stage of business analytics application advancement is cognitive analytics, which involves leveraging artificial intelligence, machine learning, and advanced analytics capabilities to automate decision-making processes, enable real-time insights, and facilitate continuous learning and adaptation.
Cognitive analytics enables organizations to automate routine tasks, analyze complex data sets, identify hidden patterns, and make intelligent decisions based on real-time insights and analysis. By harnessing the power of cognitive computing and advanced analytics technologies, organizations can achieve unprecedented levels of efficiency, innovation, and agility, driving sustainable growth and competitive advantage in today’s rapidly evolving business landscape.
Also Read: What Is Big Data Analytics? Definition, Benefits, and More
Tools of Business Analytics
Business analytics tools play a crucial role in transforming raw data into actionable insights, enabling organizations to make informed decisions, optimize processes, and achieve strategic objectives. Here’s an overview of some of the key categories and examples of tools commonly used in business analytics:
1) Data Collection and Integration Tools:
- Apache Kafka: A distributed streaming platform used for building real-time data pipelines and streaming applications.
- Talend: An open-source data integration platform that enables organizations to connect, access, and manage data from various sources, ensuring data quality and consistency.
2) Data Storage and Management Tools:
- Amazon Redshift: A fully managed data warehouse service that enables organizations to analyze large datasets using SQL and BI tools.
- Google BigQuery: A serverless, highly scalable cloud data warehouse that enables real-time analytics and insights from large datasets without the need for infrastructure management.
3) Data Processing and Transformation Tools:
- Apache Spark: An open-source distributed computing system that provides in-memory processing capabilities for large-scale data processing, analytics, and machine learning tasks.
- Informatica: A data integration platform that enables organizations to transform, cleanse, and prepare data for analytics, ensuring data quality, consistency, and reliability.
4) Data Visualization and Reporting Tools:
- Tableau: A leading data visualization and business intelligence tool that enables organizations to create interactive dashboards, reports, and visualizations to explore and communicate insights from data.
- Microsoft Power BI: A business analytics service that enables organizations to visualize data, share insights across the organization, and make data-driven decisions using interactive dashboards, reports, and analytics tools.
5) Statistical Analysis and Modeling Tools:
- R: An open-source programming language and software environment specifically designed for statistical computing, data analysis, and visualization.
- Python: A versatile programming language widely used for data analysis, machine learning, and statistical modeling, with libraries such as Pandas, NumPy, and SciPy providing extensive capabilities for data manipulation, analysis, and visualization.
6) Predictive Analytics and Machine Learning Tools:
- IBM SPSS: A comprehensive statistical analysis software that enables organizations to analyze data, predict future trends, and make data-driven decisions using advanced statistical models and machine learning algorithms.
- SAS: A powerful analytics platform that provides a wide range of tools and solutions for data management, advanced analytics, machine learning, and artificial intelligence, enabling organizations to derive insights, automate processes, and drive innovation.
7) Business Intelligence Platforms:
- Sisense: A business intelligence platform that enables organizations to simplify complex data analysis, visualize insights, and share interactive dashboards and reports across the organization.
- QlikView/Qlik Sense: Business intelligence and data visualization platforms that enable organizations to create interactive dashboards, reports, and visualizations, and make data-driven decisions using self-service analytics tools.
And for those wanting to delve even deeper into this field or enhance their skills, we
highly recommend checking out the Data Analytics Course by Physics Wallah. With their comprehensive syllabus and expert instructors, you can learn everything you need to know about business analytics in one place. Don’t forget to use the coupon code ‘READER‘ at checkout for a special discount!
For Latest Tech Related Information, Join Our Official Free Telegram Group : PW Skills Telegram Group
Process of Business Analytics FAQs
What is the process in business analytics?
The process in business analytics refers to a systematic approach or methodology used to analyze data, derive insights, and make informed decisions to drive organisational success.
What is the 5 step business analytics process model?
The 5-step business analytics process model typically includes stages such as data collection, data processing and preparation, data analysis, interpretation of results, and implementation of insights to achieve business objectives.
What are the stages of business analytics?
The stages of business analytics encompass data collection, data processing and preparation, exploratory data analysis, statistical analysis and modeling, interpretation of results, implementation of insights, and continuous monitoring and optimization.
What are the 7 steps to analysis?
The 7 steps to analysis generally involve defining the problem, gathering relevant data, analyzing the data, interpreting the results, validating the findings, implementing recommendations, and monitoring outcomes to ensure effectiveness and drive continuous improvement.